Determining abnormal line defects requires systematic classification methodology distinguishing panel-intrinsic failures from integration-related visual artifacts through repeatable testing protocols.
A “line defect” is a linear artifact that may be a true row/column failure or a line-like effect caused by stress, optics, or noise. Judge abnormality by testing repeatability across power cycles, visibility under normal content, and dependency on angle, brightness, temperature, and mechanical influence. A structured pattern test plus defined viewing conditions helps avoid unnecessary returns and catches integration risks early.
Line-like complaints are easy to misjudge because very different root causes can look similar to operators. A fixed bright/dark row is not the same as gray-level banding, and neither is the same as a stress birefringence streak1 that changes with viewing angle. The fastest way to make correct decisions is to see whether the artifact locks to the pixel grid, whether it repeats under the same conditions, and whether it changes when you vary the environment or assembly state.
What counts as a "line defect" in LCD display modules?
Line defects represent linear visual artifacts that can originate from panel components, driving circuits, or integration stress requiring systematic classification for proper assessment.
A line defect is a persistent linear artifact that follows a row/column direction or appears as a continuous bright/dark streak. It can originate from the pixel array, source/gate driving, flex interconnects, or module assembly stress. Some lines are always visible; others appear only with certain patterns, brightness levels, temperatures, or after warm-up. First, document direction, location, persistence, and triggers to separate panel failures from optical or stress artifacts.
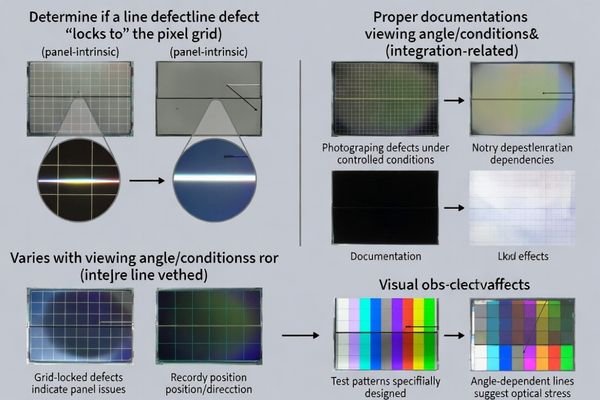
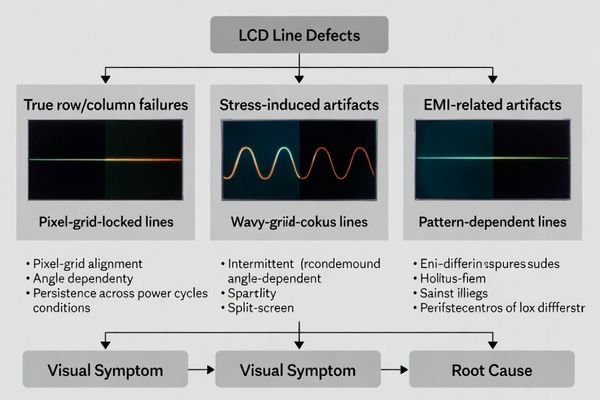
A practical classification starts with what the line “locks to.” If it aligns perfectly with the pixel grid and stays fixed in the same position across different content, it may indicate a row/column or driver/interconnect issue. If it changes with angle, polarization, or mechanical pressure, it is often driven by optical stack stress or reflections. If it correlates with nearby motors, cable motion, or operating states, noise coupling and EMI become likely contributors.
Panel-Intrinsic Line Defects2
Panel-intrinsic line defects typically track the pixel grid and remain fixed in position. They often present as a single bright line, dark line, or a line that appears consistently at the same row/column under multiple patterns. These defects are usually repeatable across power cycles and do not “move” with UI content. When the behavior is stable and grid-locked, it should be treated as a true defect unless a known driving configuration issue is proven to be the cause.
Integration-Related Line Artifacts
Integration-related artifacts can look like lines but behave differently: they may change with viewing angle, polarization, temperature, or mechanical constraint. Stress in the optical stack can produce streaks that do not precisely align to the pixel grid, or that vary in intensity as the assembly warms up. EMI-related effects may be intermittent, appear during specific machine events, or show as flicker/instability rather than a perfectly stable line. These cases require correlation testing rather than immediate panel replacement.
Which quick checks help distinguish abnormal defects from normal visual phenomena?
Fast screening methodology focuses on repeatability, dependency, and environmental sensitivity to separate true defects from normal visual variations and integration artifacts.
Quick checks focus on dependency: whether the line moves with content, changes with brightness/backlight level, or changes with viewing angle and polarization (tilt the view or rotate polarized sunglasses). Then run solid colors (white/gray/black) and slow gradients to see if it follows the pixel grid or looks like banding. Finally compare cold start vs warm-up and apply only gentle, non-damaging influence near mounting points to test stress sensitivity.
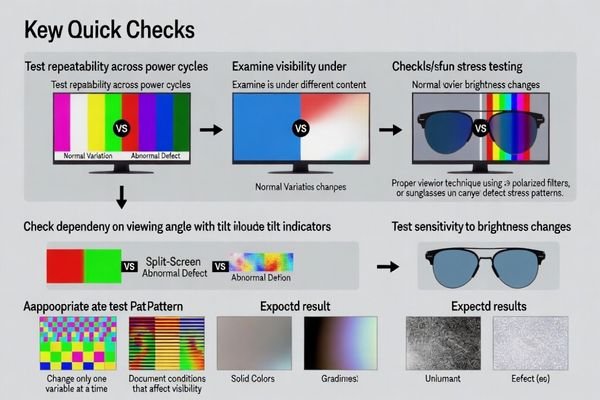
These checks are designed to prevent two common mistakes: rejecting good panels due to optical artifacts3, and accepting risky assemblies because the symptom was not reproduced properly. Always repeat tests under the same defined conditions, then change one variable at a time. If the artifact is highly angle-dependent, treat the optical stack as suspect. If it is grid-locked and repeatable, prioritize panel/driver/interconnect investigation.
How do content patterns, drive settings, and temperature affect line visibility?
Line defect visibility depends significantly on display conditions, drive parameters, and environmental factors that can mask or emphasize different types of artifacts.
Line visibility depends on conditions: mid-grays and near-black often reveal mura/banding that white can hide, while high-contrast edges make single-line anomalies look sharper. Drive parameters (timing margins, gamma/Vcom tuning, dimming modes) can shift visibility by changing response and uniformity, especially in marginal cases. Temperature and warm-up change electrical thresholds and mechanical stress, so heat-dependent lines may indicate stress growth, adhesive creep, or driving drift rather than permanent row/column damage.
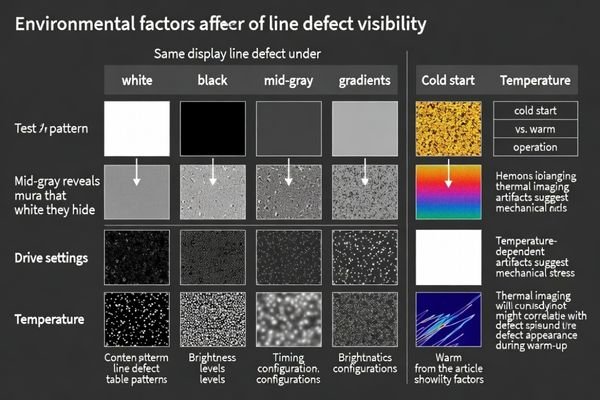
To avoid false conclusions, use a small, consistent pattern set and record settings each time. Many “defects” are only visible on extreme gradients or specific gray steps and are not noticeable in normal content. Conversely, a line that is faint on test patterns but obvious on text or barcode-like graphics can still be functionally harmful. Temperature is a major discriminator: if the artifact strengthens after warm-up or during thermal cycling, treat mechanical stress and stack behavior as primary suspects.
| Visibility Factor | Impact on Line Detection | Assessment Method | Interpretation Guidance |
|---|---|---|---|
| Content Patterns | Mid-gray reveals mura, high contrast emphasizes edges | Test white, gray, black, gradients | Normal if only visible on extreme patterns |
| Drive Settings | Timing margins affect uniformity, gamma shifts visibility | Vary brightness, gamma, refresh rate | Configuration-dependent artifacts may be normal |
| Temperature Effects4 | Warm-up changes electrical and mechanical balance | Compare cold start versus operational temperature | Heat-dependent lines may indicate stress issues |
| Viewing Conditions | Angle and polarization affect stress birefringence | Test multiple angles, use polarized filters | Angle-dependent artifacts suggest optical stress |
Environmental factor analysis enables accurate assessment of line defect significance by distinguishing between display condition artifacts and genuine panel failures requiring corrective action.
What criteria and acceptance logic should you use to judge "abnormal"?
Abnormality assessment requires objective criteria based on user-visible impact under defined conditions rather than subjective visual impressions or extreme test scenarios.
Judge abnormality under defined viewing conditions using normal-use content and repeatable patterns. A defect is typically abnormal if it is visible during normal content, repeats across power cycles, and cannot be removed by normal configuration controls. Treat grid-locked bright/dark row/column lines, or stress-driven marks that worsen with assembly/temperature, as higher risk. Use a clear go/no-go matrix to separate cosmetic-only artifacts from functional impact on readability and operational graphics.
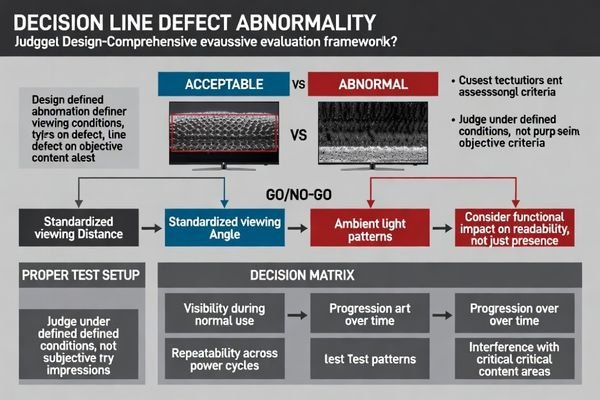
A usable acceptance logic turns subjective debates into consistent decisions. Define the viewing setup (distance, angle, ambient light), define the patterns, define the brightness state, then judge whether the artifact is visible under typical UI content. Add repeatability rules: does it appear after every power cycle, and does it remain stable during operation? Finally add risk rules: does it grow over time, does it correlate with heat or stress, and does it interfere with critical information like text, icons, or barcode-like elements?
User-Visible Impact Assessment
Normal Use Visibility:
Evaluate visibility under typical content for the product: text-heavy screens, icons, status bars, and any critical operational graphics. Use representative lighting and viewing distance, not only a dark lab condition. A line that is noticeable during real operation should be treated more strictly than one that only appears during extreme test gradients.
Persistence and Repeatability:
Check repeatability across multiple power cycles and operating modes. If a line appears in the same location every time under the same conditions, it is more likely a true defect than a transient artifact. If it changes with standard configuration controls, document the dependency and determine whether the “fixed” configuration is acceptable and stable for production.
Functional and Reliability Risk Evaluation
Content Interference Analysis:
Decide whether the line affects readability or interpretation: text legibility, symbol recognition, and any machine-vision or scanning-related visual cues on the UI. Even a thin line may be unacceptable if it crosses a critical area or reduces contrast where operators must make fast decisions.
Progressive Failure Indicators5:
Flag artifacts that worsen with heat, time, or mechanical constraint, or that appear intermittently with increasing frequency. These can indicate marginal interconnects, stress concentration, or electrical noise susceptibility that may degrade in the field, even if initial appearance is borderline.
How do you investigate root cause and prevent recurring line defects?
Effective root cause analysis traces defects through signal and stress pathways while implementing prevention strategies that address both panel and integration factors.
Investigate along two chains: signal and stress. Confirm whether the line is panel-intrinsic (fixed row/column behavior) or integration-driven (stress, optical stack, grounding/EMI). Use controlled pattern tests to document conditions, then correlate with electrical checks (power stability, timing, tuning state) and mechanical checks (mounting flatness, torque, gasket compression, cover lens bonding). If stress-sensitive, reduce localized pressure and manage thermal expansion; if drive-dependent, review margins and calibration; if noise-correlated, improve grounding and coupling control.
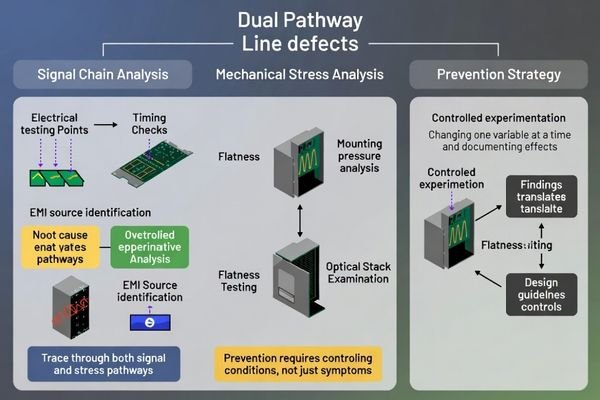
Preventing recurrence is usually about controlling the condition that makes the line visible, not only documenting the symptom. Build a small experiment plan: reproduce, change one variable, and observe whether the line changes. If mechanical relaxation or a small seating change alters the line, prioritize stack and mounting redesign. If changing operating states or nearby EMI events alters the line, prioritize grounding and routing improvements. Close the loop by validating with temperature and time, since many line-like artifacts are driven by warm-up and drift.
Based on my experience with line defect investigation and prevention, systematic root cause analysis combined with proactive design optimization provides the most effective approach for maintaining display quality and preventing field failures in demanding applications. For complex line defect investigation requiring systematic root cause analysis6 and prevention strategy development during LCD module quality assessment projects demanding comprehensive electrical and mechanical evaluation, engineering teams can contact info@lcdmodulepro.com when defect analysis challenges require specialized expertise in signal integrity assessment and integration optimization for reliable display performance.
Signal Chain Analysis and Electrical Investigation
Panel-Level Assessment:
Use repeatable test patterns to confirm whether the artifact is fixed to a specific row/column location and whether it persists across content and power cycles. Where possible, compare behavior across input formats or initialization sequences to rule out software/state issues that can masquerade as “line defects.”
Drive System Evaluation:
Review timing configuration and tuning states used in the system. If the artifact changes with brightness, gamma state, or refresh configuration, treat it as a condition-dependent issue and verify stability across temperature and operating modes. Avoid declaring “fixed” until you have repeated the result under the same defined conditions.
EMI and Grounding Analysis:
Look for correlation with machine events: motor switching, actuator motion, scanner activity, or cable movement. Improve routing, grounding return paths, and shielding where needed, then re-test using the same patterns and viewing setup. A symptom that changes significantly after EMI mitigation points to integration sensitivity rather than intrinsic panel damage.
Mechanical Stress Analysis and Prevention Strategy
Assembly Stress Assessment:
Check mounting flatness, fastening torque, and gasket compression uniformity. Uneven seating can concentrate stress and create line-like birefringence patterns that evolve after warm-up. If gentle influence near a mounting area changes the artifact, redesign to reduce localized pressure and improve constraint distribution.
Optical Stack Optimization:
Validate cover lens bonding and polarizer stress behavior across warm-up and temperature cycling. Adhesive creep and differential thermal expansion can shift stress patterns over time. Material selection and process controls can stabilize the stack so the appearance remains consistent across builds.
Prevention Strategy Implementation:
Translate findings into controls: mechanical guidelines (torque limits, flatness targets), electrical guidelines (power margin, grounding rules), and test gates (standard patterns under defined conditions). A consistent measurement recipe prevents “decision drift” across teams and improves long-term reliability.
FAQ
Is a single-pixel-wide line always a panel failure?
Not always. It can indicate a row/column driver issue, but similar-looking lines can also come from stress marks or optical interactions; confirm with pattern tests and angle dependence first.
Why do lines show up more on gray than on white?
Mid-gray levels often reveal mura and subtle non-uniformity more clearly, while full white can mask faint variations; use multiple gray steps to judge severity.
Can mechanical stress create line-like artifacts?
Yes. Local pressure, warp, or uneven mounting can create stress birefringence patterns that look like lines and may change with temperature and viewing angle.
How can I tell if EMI is involved?
EMI-related artifacts often correlate with motor/actuator events, cable motion, or specific operating states; improving grounding, shielding, and routing can change the symptom.
What evidence should I collect before escalating?
Capture photos/videos under defined patterns and conditions, note warm-up time, brightness, angle, and recovery behavior, and record any mechanical or electrical changes that affect the defect.
When should I treat a line defect as a reliability risk?
If it grows, becomes more frequent, or appears under normal content across power cycles, it may indicate a marginal driver/interconnect or stress condition that could worsen in the field.
Conclusion
Line defect assessment requires systematic classification methodology that distinguishes panel-intrinsic failures from integration-related artifacts through structured testing protocols and objective abnormality criteria. Effective evaluation focuses on environmental dependencies, pattern correlation, and user-visible impact under defined conditions rather than subjective visual impressions or extreme test scenarios. By implementing quick screening checks, environmental factor analysis, and comprehensive root cause investigation procedures, teams can separate cosmetic tolerances from functional risks while preventing recurring defects through proactive design optimization and assembly process control.
MEIDAYINGNUO provides comprehensive line defect analysis and quality assessment services for LCD module applications requiring systematic evaluation methodology, root cause investigation, and prevention strategy development for reliable visual performance in demanding operational environments. Our engineering team offers specialized expertise in defect classification, environmental testing, signal integrity analysis, and integration optimization ensuring LCD modules maintain consistent display quality while minimizing field failures and warranty issues throughout extended deployment lifecycles. Contact our quality assessment specialists when line defect challenges require expert investigation methodology and systematic prevention strategy development for successful display integration projects.
✉️ info@lcdmodulepro.com
🌐 https://lcdmodulepro.com/
-
Exploring stress birefringence streaks will enhance your knowledge of material behavior under stress. ↩
-
Understanding these defects is crucial for diagnosing display issues and ensuring optimal performance. ↩
-
Understanding optical artifacts is crucial for accurate panel testing and avoiding costly mistakes. ↩
-
Understanding temperature effects can help identify stress issues in displays, ensuring better performance and longevity. ↩
-
Exploring this topic helps identify potential long-term issues that could affect product performance. ↩
-
Understanding systematic root cause analysis can enhance your approach to defect investigation and prevention. ↩