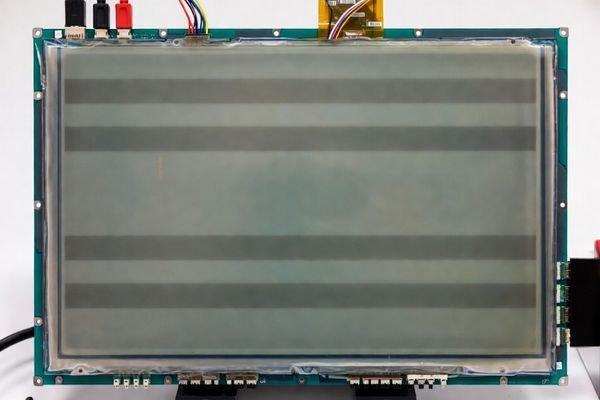
One of the most elusive integration problems is periodic noise bars on an LCD display module—faint, repeating bands that may drift slowly and appear only in certain operating states. Because the video link can look “perfect,” teams often chase timing or panel defects when the real cause is power integrity.
Diagnose periodic noise bars by proving correlation to power behavior: reproduce the bars, link their intensity or movement to load changes (backlight, CPU, motors), then measure ripple and ground offsets at the display connector. Once you identify the noisy rail and aggressor load, validate fixes such as return-path improvements, power-tree separation, and targeted filtering under worst-case cabinet conditions.
In LCD Module Pro customer integrations, periodic bars are a classic symptom of power noise coupling1 into sensitive display circuits. The root cause is rarely the LCD module itself; it’s usually how rails are generated, distributed, and referenced in the full system. The fastest path to a real fix is not “add capacitors everywhere,” but a disciplined workflow: classify the artifact, correlate it to system activity, measure at the module connector, isolate the aggressor, and then prove the fix by regression testing.
This article lays out that workflow so you can move from “it happens sometimes” to a repeatable diagnosis and an engineering-verified solution.
The first step is to characterize the visual behavior and confirm it tracks power conditions rather than video mode configuration.
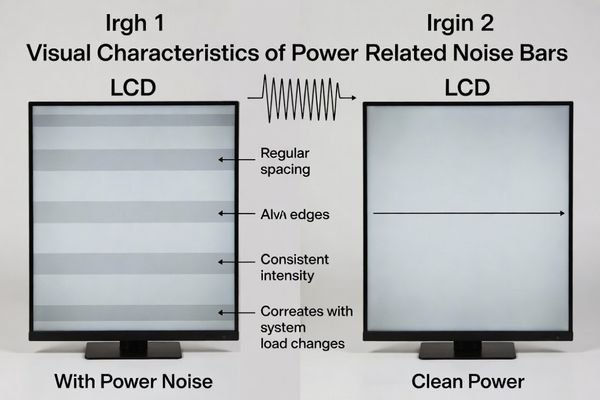
Power-related noise bars typically appear as evenly spaced horizontal or vertical bands that are stationary or drift slowly. They often change intensity with load states—backlight brightness, CPU load, motors, or switching-regulator mode changes. A strong confirmation is that the bars change or disappear when you keep video timing constant but improve supply cleanliness (for example, powering the display rails from a quiet bench supply).
Correlation is the key. If a visible artifact responds to power-domain changes while the video configuration stays the same, it is almost always power-coupled.
Visual Characteristics
Noise bars are usually faint with soft edges, and their spacing is regular. Slow drift is especially telling because it often reflects a low-frequency envelope (beat) created by two switching regulators operating at nearby frequencies, producing a slowly varying modulation that becomes visible as moving bands.
Confirming the Power Link
The goal is to modulate the bars by changing power-state variables while holding the video mode fixed.
- Change backlight brightness2: Ramp brightness through the operating range. If bars worsen at higher brightness, the backlight driver or shared return path is a strong suspect.
- Vary system load: Trigger known load events (CPU load steps, motor/compressor start, RF activity). If bars appear or intensify in sync, you’ve established correlation.
- Isolate with a quiet supply: Keep the video link unchanged, but power the display logic/backlight rails from a clean bench supply (where practical). If bars disappear or drop dramatically, that is strong confirmation the system power tree is the source.
Which power-noise coupling paths most commonly create visible bars?
Once power coupling is suspected, the next step is to understand how the noise reaches the display and why it becomes visible as bands.
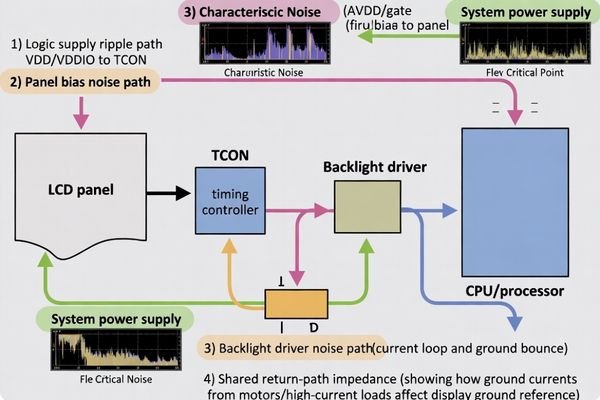
Common coupling paths include ripple on logic rails (VDD/VDDIO) that modulates receiver thresholds, noise on panel bias rails that modulates pixel drive, backlight driver ripple/ground bounce that shifts the display reference, and shared return-path impedance that converts load pulses into visible reference movement. Beat frequencies between converters can create slow-moving bars.
Most real failures involve an aggressor (noisy load) and a victim (display rail/reference) connected by a specific coupling mechanism.
Here are the most common paths:
- Logic supply ripple (VDD/VDDIO)3: Ripple can shift sampling thresholds and introduce structured errors that look like bands rather than random sparkles.
- Panel bias rail noise (e.g., AVDD / gate bias rails): Noise can directly modulate pixel voltages, producing brightness variation that appears as bars.
- Backlight driver noise: High-current switching can inject conducted ripple on its input rail and create ground bounce that couples into the panel reference.
- Shared return-path impedance: If motors and the display share return paths, current pulses create varying ground reference at the display connector, which can map into visible banding.
A critical diagnostic point: measure what the display sees at the connector. Rail ripple at the regulator may look acceptable while ripple at the module is much worse due to harness impedance and return-path inductance.
How do you separate power-noise bars from timing, mapping, or signal-integrity artifacts?
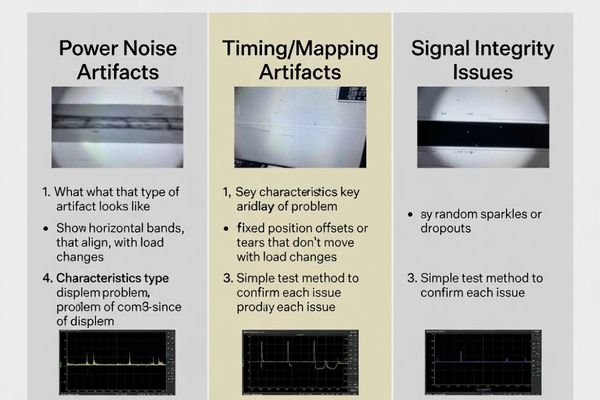
Avoiding misdiagnosis saves days. Power bars have a different “response signature” than timing/mapping or SI problems.
Power-noise bars track load state and supply behavior; timing/mapping artifacts are deterministic to a video mode and don’t change with load. SI issues typically create sparkles, link errors, or dropouts and often worsen with cable length. The fastest A/B test is to keep the video mode fixed and vary only power conditions—if the bars respond strongly, power coupling is the likely cause.
A practical one-domain-at-a-time approach:
- Keep power and wiring constant; change only timing/mode. If bars don’t move or change, it’s unlikely to be timing.
- Keep timing/mode constant; change only power/load. If bars scale with load, it’s power integrity.
- If artifacts worsen primarily with longer cables and show intermittent errors, SI/EMI4 is more likely than pure power ripple.
What measurements and tests pinpoint the noisy rail and the aggressor load?
After correlation, the “smoking gun” is found by measuring ripple and ground offsets where the module is actually connected.
Measure ripple at the LCD module connector—not just at the regulator—on logic rails, bias rails, and backlight input, and measure ground-to-ground offsets under load. Use proper probing to avoid artifacts, then toggle suspected aggressor loads while correlating ripple frequency/amplitude to bar behavior to identify both the noisy rail and the source.
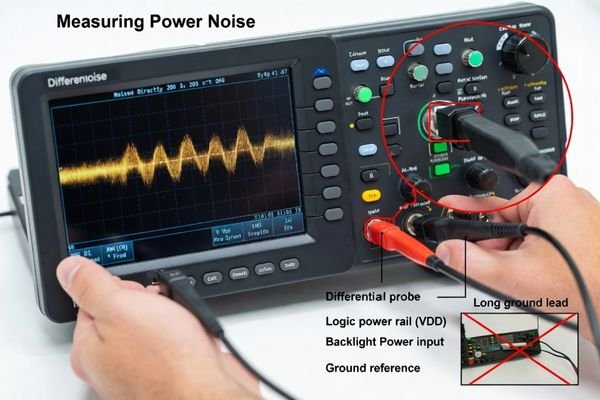
A disciplined measurement sequence:
- Probe at the victim (connector): Measure at the module input pins; harness and return-path impedance often dominate what the module sees.
- Use correct probing: Differential probing (or very short ground technique) reduces false readings caused by probe ground-lead pickup.
- Measure all relevant rails and references: Logic rails, any bias rails, backlight input, and the voltage between display ground and system ground under load to reveal ground bounce5.
- Correlate with aggressor activity: While monitoring ripple, step backlight brightness, start/stop motors, and change CPU load. If a ripple component or envelope appears in sync with the bars, you’ve identified the aggressor and the coupling path.
If you suspect beat behavior, compare the bar drift rate to the difference between two converter switching frequencies; a near match is a strong indicator of beat coupling.
What LCD module and integration choices reduce power-noise bar risk in real products?
The best fix is to design margin in from the start: a clean power tree, controlled return paths, and validation under real conditions.
Reduce power-noise bar risk by separating sensitive display rails from noisy loads, enforcing low-impedance grounding and return paths, placing effective decoupling close to the display connector, and validating early with production harnesses and worst-noise operating states. Filters can help, but many persistent cases require return-path and power-tree changes, not only more capacitance.
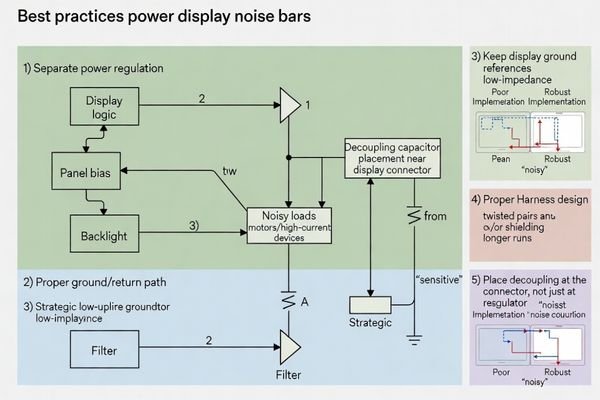
Practical prevention principles:
- Power tree separation: Use dedicated, quiet regulation for display logic/bias rails; keep motors and other high-current switching loads off shared sensitive rails where possible.
- Grounding strategy: Avoid long shared ground wires; use low-impedance return paths (ground planes or carefully designed star returns) to prevent reference movement at the display connector.
- Decoupling near the connector: Place appropriate local decoupling to reduce high-frequency ripple at the module input; use targeted impedance control rather than blanket capacitor addition.
- Harness design: Control return paths (twisted power/return pairs where appropriate) and reduce loop area; consider shielding when the environment is extremely noisy.
- Early, realistic validation: Test in representative enclosures with production harnesses under worst-case combined noise states: max backlight, motor start, high compute load, and any RF/payment activity.
When mechanical constraints force long harnesses or shared grounds, tailoring the integration (power distribution, grounding, filtering, and validation plan) often reduces risk more reliably than late-stage patch fixes.
FAQ
Why do noise bars get worse when I increase backlight brightness?
Higher backlight current increases load pulses and ground bounce, which can raise ripple on shared rails and references that the panel uses for sampling and pixel drive.
Can two switching regulators create slow-moving bars?
Yes. Similar switching frequencies can produce a low-frequency beat envelope that shows up as drifting bands.
If the image is stable, does that rule out signal integrity issues?
Not completely, but stable geometry with bars that track load state is more consistent with power noise than classic SI faults like dropouts or random sparkles.
Where should I probe first to diagnose power-noise bars?
At the display connector rails and local grounds, because cable drop and return-path impedance can make the module see worse ripple than the regulator node.
Do filters always fix periodic bars?
Not always. If the root cause is shared return-path impedance or beat coupling between converters, you may need grounding and power-tree changes, not only added capacitance.
When is customization preferable for persistent noise-bar problems?
When long harnesses, multiple noisy loads, or strict EMC limits exist, tailoring power distribution, grounding, and filtering can reduce field risk.
Conclusion
Diagnosing periodic noise bars is fundamentally a correlation-and-isolation problem. Reproduce the artifact, link it to load state and rail ripple behavior, and measure at the display connector to find what the module actually sees. Once the noisy rail, aggressor load, and coupling path are identified, robust fixes typically involve power-tree separation, grounding/return-path improvements, and targeted filtering—validated under worst-case cabinet conditions with real harnesses.
At LCD Module Pro, we help teams debug power-coupled artifacts by focusing on connector-level measurements, controlled A/B isolation, and integration-aware validation so periodic bars are eliminated before deployment.
✉️ info@lcdmodulepro.com
🌐 https://lcdmodulepro.com/
-
Understanding power noise coupling is crucial for diagnosing display issues effectively. ↩
-
Exploring the impact of backlight brightness on displays can provide insights into optimizing visual quality and performance. ↩
-
Understanding Logic supply ripple is crucial for diagnosing display issues, as it can lead to significant errors in visual output. ↩
-
Exploring SI and EMI helps in diagnosing issues related to signal integrity and electromagnetic interference. ↩
-
Exploring ground bounce will provide insights into its effects on circuit performance and how to mitigate it. ↩